Windows Memory & Processes
Task 1 Introduction
Knowing how to analyze memory is an essential skill for a forensic analyst. Attackers often run their malware completely in memory without leaving any traces on the storage. Analyzing memory is slightly more complex than storage and requires a structured approach. Luckily, tools like Volatility and Redline can help extract information from memory. These tools don't automate the whole process of memory analysis. It is still up to the forensic analyst to extract the correct information and link it together.
This room is the first in a set of three. It will guide you through analyzing a full memory dump of a Windows host and extracting information from its processes. If the host is indeed compromised, you will need to piece together the scope of the attack and the attack chain.
Learning Objectives
- Extract processes and process information from a memory dump using Volatility
- Analyze the extracted information
- Report findings
Room Prerequisites
- Volatility
- Windows Fundamentals module
Ready to start analyzing your first memory dump?
No answer needed
Task 2 Scenario Information
Scenario
You are part of the incident response team handling an incident at TryHatMe - a company that exclusively sells hats online. You are tasked with analyzing a full memory dump of a potentially compromised Windows host. Before you, another analyst had already taken a full memory dump and gathered all the necessary information from the TryHatMe IT support team. You are a bit nervous since this is your first case, but don't worry; a senior analyst will guide you.
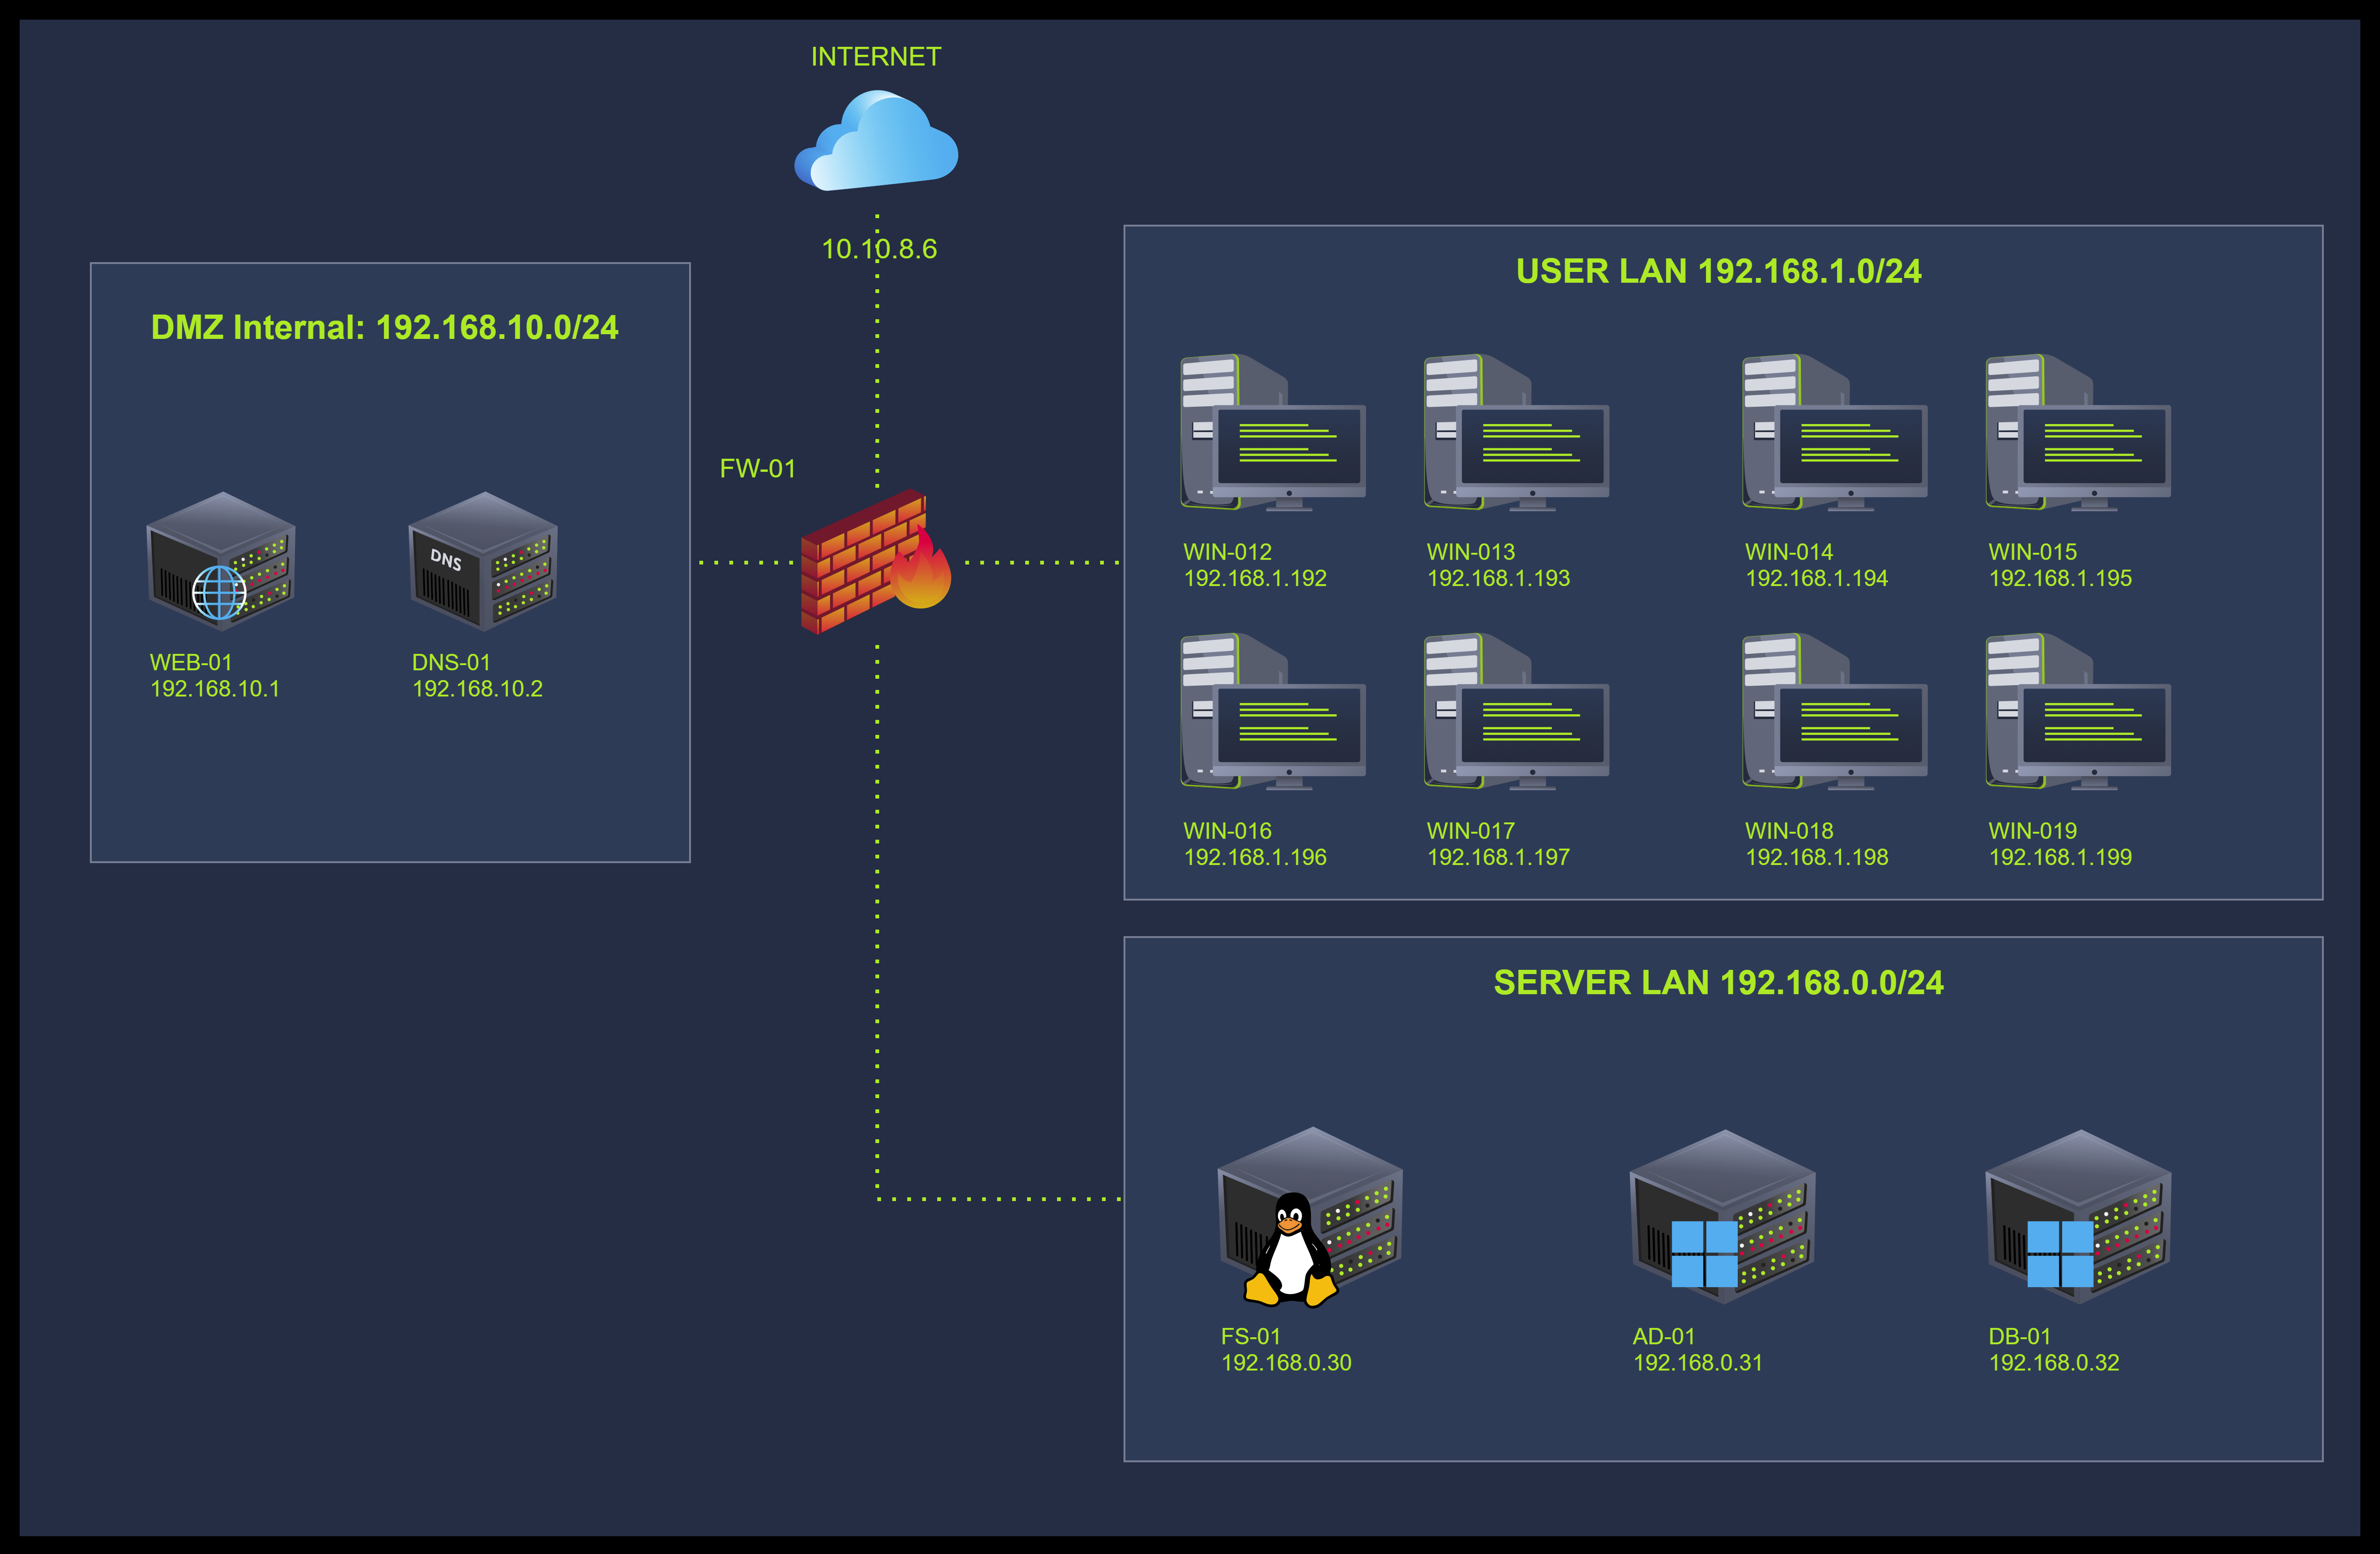
Information Incident THM-0001
- On May 5th, 2025, at 07:30 CET, TryHatMe initiated its incident response plan and escalated the incident to us. After an initial triage, our team found a Windows host that was potentially compromised. The details of the host are as follows:
- Hostname: WIN-001
- OS: Windows 1022H 10.0.19045
- At 07:45 CET, our analyst Steve Stevenson took a full memory dump of the Windows host and made a hash to ensure its integrity. The memory dump details are:
- Name:
THM-WIN-001_071528_07052025.dmp - MD5-hash:
78535fc49ab54fed57919255709ae650
- Name:
Company Information TryHatMe
Network Map
I went through the case details and am ready to find out more.
No answer needed
Task 3 Windows Process Architecture
You might wonder where to start analyzing the memory dump. Let's start with a high-level overview of the key structures of processes on a Windows host. These structures are essential to understand where tools like volatility extract their information.
Windows Processes and Threads
There are four structures that Windows uses to create and manage processes:
- EPROCESS is the representation of a process in the kernel
- ETHREAD is the representation of a thread in the kernel
- Process Environment Block (PEB) holds the process-wide configuration and runtime data and is located in the user space
- Thread Environment Block (TEB) holds the thread-specific configuration and other information, including Thread Local Storage (TLS), exception handling data, and information about the stack, and is located in the user space

How Do These Structures Relate?
When Windows creates a process, it executes the function CreateProcess(). This function initiates the process start-up and consists of the following steps:
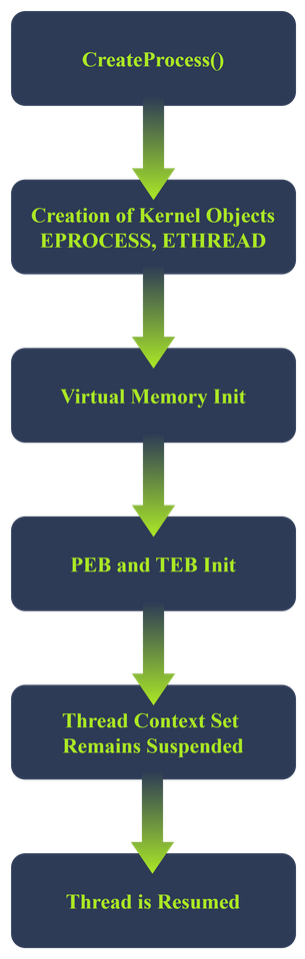
- The kernel creates an EPROCESS and ETHREAD object and links them together. EPROCESS has a field called
ThreadListHeadthat keeps track of all its threads - The virtual memory is initialized:
- The process is assigned a virtual address space (in user mode) The image (EXE) is mapped into memory Space is allocated for the PEB and TEB Process parameters are created
- The PEB and TEB are initialized.
- EPROCESS includes a pointer to the PEB
- ETHREAD includes a pointer to the TEB
- TEB includes a redundant pointer to the PEB
- The thread context is set but remains suspended. This thread context includes:
- Start address of the program
- Stack pointer
- Instruction pointer
- The process is created but is still suspended
- The primary thread of the process is resumed. This is the actual start of the process
What Information Can You Extract From These Structures?
Tools like volatility understand a process's architecture and can extract and relate data from these structures. Specific volatility modules will target certain fields of these structures. Below, you can find an overview of interesting fields for each structure. Note: Only the relevant fields are listed for each structure. The other fields have been omitted.
EPROCESS
The following volatility plugins extract information from EPROCESS: pslist, pstree, psscan, malfind, getsids, handles, dlllist, cmdline, envars and ldrmodules. In the terminal below, you can find the fields these modules target:
struct _EPROCESS {
    HANDLE UniqueProcessId; // PID (Process ID)
    LIST_ENTRY ActiveProcessLinks; // Link in active process list (Used to keep track of all active processes)
    UCHAR ImageFileName[15]; // Short process name LARGE_INTEGER CreateTime; // Process creation time
    LARGE_INTEGER ExitTime; // Exit time if terminated
    PPEB Peb; // Pointer to user-mode PEB
    HANDLE InheritedFromUniqueProcessId; // Parent PID
    LIST_ENTRY ThreadListHead; // List of ETHREADs
    PHANDLE_TABLE ObjectTable; // Handle table (points to opened files)
    PVOID SectionObject; // Executable image mapping
    PVOID VadRoot; // VAD tree for memory mapping PACCESS_TOKEN Token; // Security information
}
ETHREAD
The following volatility plugins extract information from ETHREAD: threads, ldrmodules, apihooks and malfind. In the terminal below, you can find the fields these modules target:
struct _ETHREAD {
    CLIENT_ID Cid; // Thread and Process IDs
    LARGE_INTEGER CreateTime; // Thread creation time
    LARGE_INTEGER ExitTime; // Thread exit time
    PVOID StartAddress; // Kernel-level entry point
    PVOID Win32StartAddress; // User-mode entry point
    LIST_ENTRY ThreadListEntry; // Link in EPROCESS's thread list
    PTEB Teb; // Pointer to TEB
    ULONG ThreadState; // Thread execution state
    ULONG WaitReason; // Reason for being blocked
}
PEB
The following volatility plugins extract information from the Process Environment Block: cmdline, envars, ldrmodules and malfind. In the terminal below, you can find the fields these modules target:
struct _PEB {
    BOOLEAN BeingDebugged; // Debug flag
    PVOID ImageBaseAddress; // Base address of executable
    PPEB_LDR_DATA Ldr; // Loader data (DLLs)
    PRTL_USER_PROCESS_PARAMETERS ProcessParameters;// Command-line, environment variables
    ULONG NtGlobalFlag; // Debugging heap flags
    PVOID ProcessHeap; // Default process heap
}
TEB
The following volatility plugins extract information from the Thread Environment Block: threads and malfind. In the terminal below, you can find the fields these modules target:
struct _TEB {
    PVOID EnvironmentPointer; // Pointer to env block
    CLIENT_ID ClientId; // Thread + Process IDs
    PVOID ThreadLocalStoragePointer; // TLS base
    PPEB ProcessEnvironmentBlock; // Pointer to PEB
    ULONG LastErrorValue; // Last error value
    PVOID StackBase; // Upper bound of thread stack
    PVOID StackLimit; // Lower bound of thread stack
    PVOID Win32ThreadInfo; // GUI subsystem data
}
What field is used to keep track of all the active processes? Only enter the fields' name.
ActiveProcessLinks
What field is used to store the PID of a process? Only enter the fields' name.
UniqueProcessId
Task 4 Initial Triage of a New Memory Dump
You refreshed your knowledge of Windows memory and processes in the previous task. You are ready to tackle the fun challenge of analyzing the provided memory dump. During this task, you will start up the analysis VM and verify the hash of the memory dump. Then, you will continue extracting the processes in the memory dump using volatility. After that, you will analyze the results and look for suspicious processes. Last, you will note down your findings.
Environment and Setup
During your investigation, you will use an Ubuntu Desktop host with the memory analysis tool volatility version 3. We have assigned the alias vol3 to the full command (python3 vol.py) to start volatility. Start the VM now by clicking the Start Machine button at the top of this task. The VM will start in split view. In case it’s not showing up, you can press the Show Split View button at the top of the page.
The default installation of Ubuntu Desktop comes with command-line utilities that supplement volatility and allow you to parse the analysis results in additional detail. These tools include strings, diff, grep, comm, awk, and more.
Verifying the Memory Dump
Open a shell on the analysis VM and navigate to /home/ubuntu. Then use the md5sum command to calculate the MD5 hash of the memory dump. Note: You don't need to enter the command. We have already pre-calculated the hash for you. Due to restrained resources it could take up to five minutes to calculate an MD5 hash.
ubuntu@tryhackme:~$ md5sum THM-WIN-001_071528_07052025.mem > newhash.txt
Then, compare the newly calculated hash with the hash that you received from your colleague who did the memory acquisition:
ubuntu@tryhackme:~$ diff acquisitionhash.txt newhash.txt
If the above command shows no output, the hashes are the same. Now that you have verified the integrity of the memory dump, you can proceed with extracting its content.
Extract Processes
volatility comes with multiple modules that can help you extract processes and their information:
windows.pslist: extract a list of the active processes at the time of the memory dumpwindows.psscan: extract all process objects, including terminated and unlinked processeswindows.pstree: extracts a list of the active processes at the time of the memory dump and visualizes the parent-child relationships between themwindows.psxview: uses multiple process detection techniques to gather information about processes, threads, process structures, and handles, then cross-reference and compare this information.
Navigate to the VM and open a terminal. Now, enter the commands below to extract the active processes from the memory dump and save them in a text file. Note: Due to size of the memory dump and limited resources, it can take up to a minute until the command finishes running.
ubuntu@tryhackme:~$ vol3 -f THM-WIN-001_071528_07052025.mem windows.pslist > pslist.txt
Now, use cat to display the content of pslist.txt and analyze the output. Here is a tip: pipe the output to the command less to get a scrollable output. You can then press space to scroll through the output. You can press q to exit.
ubuntu@tryhackme:~$ cat pslist.txt | less
Volatility 3 Framework 2.26.2
PID PPID ImageFileName Offset(V) Threads Handles SessionId Wow64 CreateTime ExitTime File output

4   0   System         0x990b2366a040 138 - N/A False 2025-05-07 07:08:48.000000 UTC N/A Disabled
92  4   Registry       0x990b236dc080 4 - N/A False 2025-05-07 07:08:44.000000 UTC N/A Disabled
324 4   smss.exe       0x990b2680e040 2 - N/A False 2025-05-07 07:08:48.000000 UTC N/A Disabled
440 420 csrss.exe      0x990b26cf0140 12 - 0 False 2025-05-07 07:08:48.000000 UTC N/A Disabled
516 508 csrss.exe      0x990b274bd080 13 - 1 False 2025-05-07 07:08:48.000000 UTC N/A Disabled
524 420 wininit.exe    0x990b2758a140 1 - 0 False 2025-05-07 07:08:48.000000 UTC N/A Disabled
592 508 winlogon.exe   0x990b275c00c0 6 - 1 False 2025-05-07 07:08:48.000000 UTC N/A Disabled

[REDACTED FOR READABILITY]
Finding a Needle in a Haystack
You are looking for suspicious processes that match one of the indicators below:
Suspicious Name
Attackers like to use typosquatting to masquerade as a legitimate process. For example:
scvhost.exeinstead ofsvchost.exeexplorere.exeinstead ofexplorer.exelsasss.exeinstead oflsass.exe
Suspicious Path
Attackers will use process names identical to legitimate processes, but the processes are located in an unusual path. For example:
svchost.exestarting fromC:\Users\analyst\instead ofC:\Windows\System32\cmd.exestarting fromC:\TMP\instead ofC:\Windows\System32\
Masquerading
Attackers will use process names that mimic processes and system services. For example:
dockerupdater.exedefenderAV.exepdfupdateservice.exe
Comparing With a Baseline
It is sometimes difficult to distinguish between legitimate and malicious processes. The process list in the previous paragraph is luckily not so extensive, but if it were, you could use the following method to narrow down the number of processes to go through:
- Ensure you have a baseline of the processes that run on a host in normal circumstances. For example, during regular business hours
- Compare the
windows.pslistoutput with the baseline to get a shortlist of processes that were not included in the baseline - Filter the processes by comparing them to a shortlist of common processes that run when updating software. You can check the task scheduler to find these processes
- Investigate the leftover processes
Continue with the VM and enter the following commands to compare the pslist.txt file to the baseline.txt file located in ~\baseline\ (Note: the baseline file was extracted from the Task Manager, so you need to prepare it first):
ubuntu@tryhackme:~$ awk 'NR >3{print $2}' baseline/baseline.txt | sort | uniq > baseline_procs.txt
ubuntu@tryhackme:~$ awk 'NR >3{print $3}' pslist.txt | sort | uniq > current_procs.txt
ubuntu@tryhackme:~$ comm -13 baseline_procs.txt current_procs.txt
[REDACTED FOR READABILITY]
WINWORD.EXE
ai.exe
audiodg.exe
cmd.exe
fontdrvhost.ex
msdtc.exe
pdfupdater.exe
smartscreen.ex
sppsvc.exe
updater.exe
userinit.exe
vm3dservice.ex
vmtoolsd.exe
windows-update
The first two lines including awk in the terminal above prepare the files to be compared:
awk 'NR >3{print $2}'divides the files content in columns excluding the first 3 lines and then prints the n-th column as outputsortsorts the values that were passed along from theawkcommanduniq > *.txtfilters out duplicates and then saves the data to a text file
The comm command compares the content of each prepared file and outputs the difference. The flags -13 are set so only the processes unique to current_procs.txt are displayed.
The results listed in the terminal above need to be interpreted first. Some of the processes included are false positives. These are, for example:
- Legitimate processes that were not running at the time of capturing the baseline
- Processes where the
ImageFileNamefield was too long and was truncated. This field can only accommodate 16 bytes.
Knowing which processes are false positives requires some additional research. The processes below have made it onto your shortlist:
pdfupdater.exewindows-update.exeupdater.exe
Analysis Notes and Next Steps
You have found three suspicious processes that require further analysis. The table below gives an overview of these suspicious processes.
| ImageFileName | PID | Timestamp |
|---|---|---|
| pdfupdater.exe | 3392 | 2025-05-07 07:13:05.000000 |
| windows-update.exe | 10084 | 2025-05-07 07:13:05.000000 |
| updater.exe | 10032 | 2025-05-07 07:13:56.000000 |
Continue to the next task and see if these processes are linked to each other or other processes. This might help you uncover other processes that were not initially suspicious but are now suspicious within a new context.
What is the PID of the csrss.exe process that has 12 threads? You can use the pslist.txt file to find the answer.
440
What is the (memory) Offset(V) of the process with PID 5672? You can use the pslist.txt file to find the answer.
0x990b29293080
Task 5 Linking Processes
In the previous task, you found multiple separate suspicious processes. Before digging deeper into the memory of these processes, you should first uncover if there is any link between these processes and others. This will help you find other potentially suspicious processes. The terminal below shows what a malicious process tree could look like:
explorer.exe (PID: 1500)
└── cmd.exe (PID: 2200)                  ← Triggered by malicious LNK file
    └── powershell.exe (PID: 2210)       ← Downloads and executes the payload
        └── svchost.exe (PID: 2220)      ← Masquerades as a system process
            └── asyncrat.exe (PID: 2230) ← Remote Access Trojan (C2 beaconing)
The example above is an attack chain in which asyncrat, a common Remote Access Trojan, was deployed after a user clicked on a malicious LNK file. The LNK file spawns a command line, cmd.exe, which then launches PowerShell to download and execute a payload. PowerShell, in turn, uses svchost.exe to masquerade as a system process and spawns asyncrat.exe.
Continuing with the VM, enter the following command to generate a tree structure that shows the memory dump's process parent-child relationships. Note: Due to size of the memory dump and limited resources, it can take up to a minute until the command finishes running.
ubuntu@tryhackme:~$ vol3 -f THM-WIN-001_071528_07052025.mem windows.pstree > processtree.txt
The output shown with the cat command is quite overwhelming. You can use the cut command to process the processtree.txt file and only display the PID, PIDD, and image name values. Enter the following command to accomplish this:
ubuntu@tryhackme:~$ cut -d$'\t' -f1,2,3 processtree.txt
PID             PPID    ImageFileName
[REDACTED]
592             508     winlogon.exe
* 5232          592     userinit.exe
** 5672         5232    explorer.exe
*** 5952        5672    cmd.exe
**** 3144       5952    conhost.exe
*** 5252        5672    WINWORD.EXE
**** 3392       5252    pdfupdater.exe
***** 2576      3392    conhost.exe
***** 10084     3392    windows-update
****** 10032    10084   updater.exe
******* 432     10032   cmd.exe
******** 4592   432     conhost.exe
******** 6984   432     powershell.exe
**** 3932       5252    ai.exe
*** 8936        5672    SecurityHealth
*** 9096        5672    msedge.exe
**** 8100       9096    msedge.exe
**** 9164       9096    msedge.exe
**** 3500       9096    msedge.exe
**** 7408       9096    msedge.exe
**** 9264       9096    msedge.exe
**** 4152       9096    msedge.exe
**** 7420       9096    msedge.exe
[REDACTED]
The results above have been redacted for readability. The results shown include the processes of interest you discovered in the previous task.
Observations
Now locate the processes you noted during task 3 and check if they relate to other processes. Starting from the WINWORD.exe process, you can see a clear tree structure. We converted the tree to an ASCII tree structure to show it more clearly.
PID         PPID    IMAGENAME
5252        5672    WINWORD.EXE
└── 3392       5252    pdfupdater.exe
    ├── 2576      3392    conhost.exe
    └── 10084     3392    windows-update
        └── 10032    10084   updater.exe
            └── 432     10032   cmd.exe
                ├── 4592   432     conhost.exe
                └── 6984   432     powershell.exe
Now note down the observations starting from the bottom:
- The process
powershell.exewith the PID ... has the PPID ... - The process
conhost.exewith the PID ... has the PPID ... - The process linked to PPID ... is
cmd.exeand has the PID ... - And so on
Analysis Notes and Next Steps
| ImageFileName | PID | PPID | Timestamp |
|---|---|---|---|
| WINWORD.EXE | 5252 | 5672 | 2025-05-07 07:13:04.000000 |
| pdfupdater.exe | 3392 | 5252 | 2025-05-07 07:13:05.000000 |
| conhost.exe | 2576 | 3392 | 2025-05-07 07:13:05.000000 |
| windows-update.exe | 10084 | 3392 | 2025-05-07 07:13:05.000000 |
| updater.exe | 10032 | 10084 | 2025-05-07 07:13:56.000000 |
| cmd.exe | 432 | 10032 | 2025-05-07 07:14:36.000000 |
| conhost.exe | 4592 | 432 | 2025-05-07 07:14:36.000000 |
| powershell.exe | 6984 | 432 | 2025-05-07 07:14:39.000000 |
From the observations (see table above), we can conclude that the updater.exe process is a child process of windows-update.exe, a child process of pdfupdater.exe. The pdfupdater.exe process is a child of WINWORD.exe. This chain of processes seems quite suspicious:
- Multiple of these processes have the name
updatein them - The
WINDWORD.exeprocess launches thepdfupdater.exeprocess. This would mean that Microsoft Word is updating a tool related to PDF - The
pdfupdater.exeprocess then launches thewindows-update.exe. It is highly unlikely that a tool that would update one software would also launch thewindows-update.exeprocess to update the Windows OS - To top it off, the
windows-update.exeprocess launches theupdater.exeprocess, which seems to hint at yet another update - The presence of the
conhost.exeprocess also indicates that these processes seem to initiate a network connection
Looking closely at these observations and remarks and comparing them with factual information like how the Windows, PDF tool, and Microsoft Word update process works and their legitimate process names, you can conclude that this chain of processes is highly likely malicious.
Now that you have found a potential malicious chain, you must dig deeper. Proceed to the next task to uncover terminated and hidden processes and analyze the suspicious processes found in this task.
What is the parentID (PPID) of the services.exe (PID 664) process? Use the processtree.txt file to answer the question.
524
What is the ImageFileName of the process that has the PID 7788? Use the processtree.txt file to answer the question.
FTK Imager.exe
Task 6 Digging Deeper
Until now, you have focused on uncovering and linking processes that were part of the active memory. volatility can also scan for processes that were recently terminated, unlinked, or hidden by an attacker. Attackers often employ different techniques to hide processes, threads, drivers, and registry keys. You can use the volatitlity modules windows.psscan and windows.psxview to get an overview of all process structures, including those not in the active process links structure.
PSSCAN
Continuing with the VM, enter the command shown below to scan for processes that were not part of the active processes list. Note: Due to size of the memory dump and limited resources, it can take up to three minutes until the command finishes running.
ubuntu@tryhackme:~$ vol3 -f THM-WIN-001_071528_07052025.mem windows.psscan > psscan.txt
You can compare the results of psscan with the results of pslist to uncover hidden processes. You first need to prepare the output files before comparing them. Enter the following commands to extract the PID and process name from the psscan.txt and pslist.txt files and save the output to a new file.
ubuntu@tryhackme:~$ awk '{print $1,$3}' pslist.txt | sort > pslist_processed.txt
ubuntu@tryhackme:~$ awk '{print $1,$3}' psscan.txt | sort > psscan_processed.txt
Then, you can compare both files to uncover hidden processes:
ubuntu@tryhackme:~$ comm -23 psscan_processed.txt pslist_processed.txt
5548 sihost.exe
5592 svchost.exe
5736 svchost.exe
5748 svchost.exe
5752 taskhostw.exe
5828 svchost.exe
5908 svchost.exe
5972 ctfmon.exe
8708 svchost.exe
9040 vmtoolsd.exe
The results of this comparison are benign. All the listed processes are common processes that run on a Windows host. For example, svchost.exe is a common process that hosts and runs Windows services. There are a few checks you can do to verify that svchost.exe is indeed benign:
- Check the image path: If it is not located in
C:\Windows\System32\, it is suspicious - Check the DLLs loaded for this process: Attackers can use techniques like process hollowing or DLL injection to compromise a legitimate process
- Check if the process still has active threads: If it does have active threads but it doesn't appear in the
pslistresults, it is suspicious. It could be that an attacker is hiding the process - If an active process does not have any threads, it is considered suspicious. Every active process should have at least 1 thread. Attackers can use techniques to alter the threads
- Check the
Exit Time: If the process really is terminated, it should display anExit Time. If there are still active or orphaned threads linked to that process, it is suspicious. - Dump the process memory and analyze it further
You will explore some of these checks later on. PSXVIEW
Now, run the windows.psxview module. windows.psxview is a great way to do multiple tests in one and cross-reference the results. You should look for the processes that are not listed in the results of pslist but are listed in the other tests. Enter the following command to run the windows.psxview module. Note: Due to size of the memory dump and limited resources, it can take up to three minutes until the command finishes running.
PSXVIEW
Now, run the windows.psxview module. windows.psxview is a great way to do multiple tests in one and cross-reference the results. You should look for the processes that are not listed in the results of pslist but are listed in the other tests. Enter the following command to run the windows.psxview module. Note: Due to size of the memory dump and limited resources, it can take up to three minutes until the command finishes running.
ubuntu@tryhackme:~$ vol3 -f THM-WIN-001_071528_07052025.mem windows.psxview > psxview.txt
You can then use awk to filter the results and display all the lines where the pslist test equals false, as shown below:
ubuntu@tryhackme:~$ awk 'NR==3 || $4 == "False"' psxview.txt
Offset(Virtual) Name            PID     pslist  psscan  thrdscan  csrss   Exit Time
0xac80001ca080  svchost.exe     5828    False   True    False     False
0xac8000083080  svchost.exe     5592    False   True    False     False
0xac80000b90c0  vmtoolsd.exe    9040    False   True    False     False
0xac8000084080  svchost.exe     5748    False   True    False     False
0xac80001c6080  svchost.exe     5908    False   True    False     False
0xac80001d2080  ctfmon.exe      5972    False   True    False     False
0xac8000030080  svchost.exe     5736    False   True    False     False
0xac80000a1080  sihost.exe      5548    False   True    False     False
0x990b29bef080  svchost.exe     8708    False   True    False     False   2025-05-07 07:13:16+00:00
0xac8000031080  taskhostw.exe   5752    False   True    False     False
The output in the terminal above doesn't show anything obvious that could hint at an attacker hiding a malicious process. However, you can never be 100% sure. If you are still suspicious of the listed processes, apply the same checks listed in the psscan section.
Analysis Notes and Next Steps
You did not uncover new processes using the volatility modules psscan and psxview.
In the next task, you will focus on analyzing the processes uncovered in the previous tasks.
What is the number of processes that have 0 Threads? Use the psscan.txt file to answer the question.
3
What is the number of processes that have the Exit Time filled in? Use the psxview.txt file to answer the question.
3
Task 7 Dumping the Process Memory
During the previous tasks, you uncovered a potentially malicious chain of processes. From the information gathered, you could only conclude that these processes are linked and that the chain starts from the WINWORD.exe process. You should focus now on extracting information from processes by dumping their memory.
volatility includes several modules to assist you with this. The modules windows.dlllist and windows.dumpfiles should help you uncover several indicators of compromise.
Finding the Path
Using the windows.dlllist module, you can uncover the path of the main executable and its linked DLLs. Continuing with the VM, run the module windows.dlllist on the processes you noted in task 5 ( WINWORD.exe, pdfupdater.exe, updater.exe, windows-update, cmd.exe, conhost.exe, powershell.exe). Enter the following commands to dump the WINWORD.exe process. Note: Due to size of the memory dump and limited resources, it can take up to two minutes until the command finishes running.
ubuntu@tryhackme:~$ vol3 -f THM-WIN-001_071528_07052025.mem windows.dlllist --pid 5252 > 5252_dlllist.txt
Now, do the same for all other processes. Then, check every file with cat, look for the path of the main executable, and note it down.
ubuntu@tryhackme:~$ cat 5252_dlllist.txt
Volatility 3 Framework 2.26.2
Progress:  100.00               PDB scanning finished
PID   Process Base  Size      Name                  Path                                                               LoadTime                File output
5252  WINWORD.EXE   0x670000  0x1ac000 WINWORD.EXE  C:\Program Files (x86)\Microsoft Office\Root\Office16\WINWORD.EXE  2025-05-07 07:13:04.00

[REDACTED FOR READABILITY]
Now, update the information you already have with the new findings.
The pdfupdater.exe, windows-update.exe, and updater.exe processes seem to start at unusual locations. This information will be helpful when you focus on investigating user activity.
Dump Process Memory
You have uncovered multiple suspicious processes until now. This suspicion is based on process names, a process tree with multiple update processes, and processes that start from a user path.
You must dump and analyze the processes' memory to confirm that these processes are malicious. You can then extract the executable and run the strings command to see if any malicious indicators are present quickly. In most cases, you will pass the executable to a malware analyst for further investigation. Below, are the commands to dump the process with PID 5252. Follow the same steps to dump the memory of the other processes; you can exclude the cmd.exe, PowerShell.exe, and conhost.exe processes. Other volatility modules can analyze these processes better. Note: Due to size of the memory dump and limited resources, it can take up to one minute until the command finishes running.
ubuntu@tryhackme:~$ mkdir 5252
ubuntu@tryhackme:~$ cd 5252
ubuntu@tryhackme:~/5252$ vol3 -f ../THM-WIN-001_071528_07052025.mem windows.dumpfiles --pid 5252
The dumped files all follow the same naming convention: file.StartAddress.EndAddress.ImageSectionObject.filename.img or file.StartAddress.EndAddress.DataSectionObject.filename.dat.
Note the differences between ImageSectionObject and DataSectionObject.
| Feature | ImageSectionObject | DataSectionObject |
|---|---|---|
| Purpose | Mapped executable image | Mapped data |
| Typical content | .exe, .dll, injected PE files | Configs, logs, unpacked payloads |
| Executable? | Yes | Usually no |
What to Look For
Depending on the process, the number of files dumped from a process can be large. You should filter for specific extensions depending on the context of the process. For example:
- If you dump the Microsoft Word process, searching for macro-enabled files with the extension
.docm,.dotm, or.dotxis interesting. Attackers often use these kinds of files to execute Visual Basic code and download the next stage of the attack. MITRE classifies this as T1059.005 – Command and Scripting Interpreter: Visual Basic - If you have a suspiciously named process, look for a
.exeand a.datfile. Use the strings command to quickly check for any malicious indicators like suspicious function names, URLs, IPs, system commands, and more - If you dump a PDF reader process, look for .pdf files. Use the strings command to check for any malicious indicators like included JavaScript quickly. MITRE classifies this as T1059.007 – Command and Scripting Interpreter: JavaScript
The process 5252 is the Windows Word process. Look for .docm or .dotm files and note your findings. Note: All the dumped files have the extension .img appended. You can verify the type of the file by using the file command.
ubuntu@tryhackme:~$ ls 5252 | grep -E ".docm|.dotm" -i
file.0x990b2ae077d0.0x990b2a3f5d70.SharedCacheMap.Normal.dotm.vacb
file.0x990b2ae077d0.0x990b2b916cd0.DataSectionObject.Normal.dotm.dat
file.0x990b2ae0ab60.0x990b28043a00.SharedCacheMap.cv-resume-test.docm.vacb
file.0x990b2ae0ab60.0x990b2a8b4b30.DataSectionObject.cv-resume-test.docm.dat

ubuntu@tryhackme:~$ file 5252/file.0x990b2ae077d0.0x990b2b916cd0.DataSectionObject.Normal.dotm.dat
5252/file.0x990b2ae077d0.0x990b2b916cd0.DataSectionObject.Normal.dotm.dat: Microsoft Word 2007+
Continue with the other processes and focus on finding .exe and .dat files. You can skip the processes cmd.exe, conhost.exe, and PowerShell.exe. These processes will be analyzed in the next rooms. You can use the following grep command to filter for .exe and .dat files.
ubuntu@tryhackme:~$ ls 3392 10084 10032 | grep -E ".exe|.dat" -i
file.0x990b2ae26720.0x990b286fa140.ImageSectionObject.updater.exe.img
file.0x990b2846e310.0x990b282f5b70.DataSectionObject.cversions.2.db.dat
file.0x990b2ae16230.0x990b29ad0270.ImageSectionObject.windows-update.exe.img
file.0x990b2ae16230.0x990b2b92ce90.DataSectionObject.windows-update.exe.dat
file.0x990b2ae0ee90.0x990b2a466010.ImageSectionObject.pdfupdater.exe.img
file.0x990b2ae0ee90.0x990b2b91f290.DataSectionObject.pdfupdater.exe.dat
Take note of all the files you find and update your findings.
Analysis Notes and Next Steps
You have analyzed the suspicious processes in more detail and uncovered multiple things:
- The paths of the
updater.exe,pdfupdater.exe, andwindows-update.exeare suspicious. All of them start in user folders - The
WINWORD.EXEprocess dump included two macro-enabled word files namedcv-resume-test.docmandnormal.dotm. These could be malicious files and need to be analyzed further
You also extracted the executables of the updater.exe, pdfupdater.exe, and windows-update.exe processes. The malware analyst needs to analyze these executables further.
The table below lists the findings.
| PID | PIDD | Timestamp | Path | Files - Executables |
|---|---|---|---|---|
| 5252 | 5672 | 2025-05-07 07:13:04.000000 | C:\Program Files (x86)\Microsoft Office\Root\Office16\WINWORD.EXE | file.0x990b2ae0ab60.0x990b2a8b4b30.DataSectionObject.cv-resume-test.docm.dat file.0x990b2ae077d0.0x990b2b916cd0.DataSectionObject.Normal.dotm.dat |
| 3392 | 5252 | 2025-05-07 07:13:05.000000 | C:\Users\operator\pdfupdater.exe | file.0x990b2ae0ee90.0x990b2a466010.ImageSectionObject.pdfupdater.exe.img file.0x990b2ae0ee90.0x990b2b91f290.DataSectionObject.pdfupdater.exe.dat |
| 2576 | 3392 | 2025-05-07 07:13:05.000000 | ??\C:\Windows\system32\conhost.exe | / |
| 10084 | 3392 | 2025-05-07 07:13:05.000000 | C:\Users\operator\AppData\Roaming\Microsoft\Windows\StartMenu\Programs\Startup\windows-update.exe | file.0x990b2ae16230.0x990b29ad0270.ImageSectionObject.windows-update.exe.img file.0x990b2ae16230.0x990b2b92ce90.DataSectionObject.windows-update.exe.dat |
| 10032 | 10084 | 2025-05-07 07:13:56.000000 | "C:\Users\operator\Downloads\updater.exe" | file.0x990b2ae26720.0x990b286fa140.ImageSectionObject.updater.exe.img |
| 432 | 10032 | 2025-05-07 07:14:36.000000 | C:\Windows\system32\cmd.exe | / |
| 4592 | 432 | 2025-05-07 07:14:36.000000 | ??\C:\Windows\system32\conhost.exe | / |
| 6984 | 432 | 2025-05-07 07:14:39.000000 | powershell | / |
Now that you have uncovered multiple indicators that point toward an attack, you need to hand the extracted artifacts to the malware analyst and/or threat hunter for further inspection.
What is the path of the process with PID 7788?
C:\Program Files\AccessData\FTK Imager\FTK Imager.exe
Dump the process with PID 7788. What is the name of the dumped file that represents the executable?
file.0x990b2ae1ed40.0x990b29954a20.ImageSectionObject.FTK Imager.exe.img
Task 8 Putting It All Together
While analyzing the memory dump, you have uncovered possible indicators of compromise. Although, some of these indicators need to be analyzed further to be certain. With the artifacts gathered and observations made, it is possible to recreate a part of the kill chain. The table below shows all the gathered information.
| PID | PIDD | Timestamp | Path | Files - Executables |
|---|---|---|---|---|
| 5252 | 5672 | 2025-05-07 07:13:04.000000 | C:\Program Files (x86)\Microsoft Office\Root\Office16\WINWORD.EXE | file.0x990b2ae0ab60.0x990b2a8b4b30.DataSectionObject.cv-resume-test.docm.dat file.0x990b2ae077d0.0x990b2b916cd0.DataSectionObject.Normal.dotm.dat |
| 3392 | 5252 | 2025-05-07 07:13:05.000000 | C:\Users\operator\pdfupdater.exe | file.0x990b2ae0ee90.0x990b2a466010.ImageSectionObject.pdfupdater.exe.img file.0x990b2ae0ee90.0x990b2b91f290.DataSectionObject.pdfupdater.exe.dat |
| 2576 | 3392 | 2025-05-07 07:13:05.000000 | ??\C:\Windows\system32\conhost.exe | / |
| 10084 | 3392 | 2025-05-07 07:13:05.000000 | C:\Users\operator\AppData\Roaming\Microsoft\Windows\Start Menu\Programs\Startup\windows-update.exe | file.0x990b2ae16230.0x990b29ad0270.ImageSectionObject.windows-update.exe.img file.0x990b2ae16230.0x990b2b92ce90.DataSectionObject.windows-update.exe.dat |
| 10032 | 10084 | 2025-05-07 07:13:56.000000 | C:\Users\operator\Downloads\updater.exe | file.0x990b2ae26720.0x990b286fa140.ImageSectionObject.updater.exe.img |
| 432 | 10032 | 2025-05-07 07:14:36.000000 | C:\Windows\system32\cmd.exe | / |
| 4592 | 432 | 2025-05-07 07:14:36.000000 | ??\C:\Windows\system32\conhost.exe | / |
| 6984 | 432 | 2025-05-07 07:14:39.000000 | powershell | / |
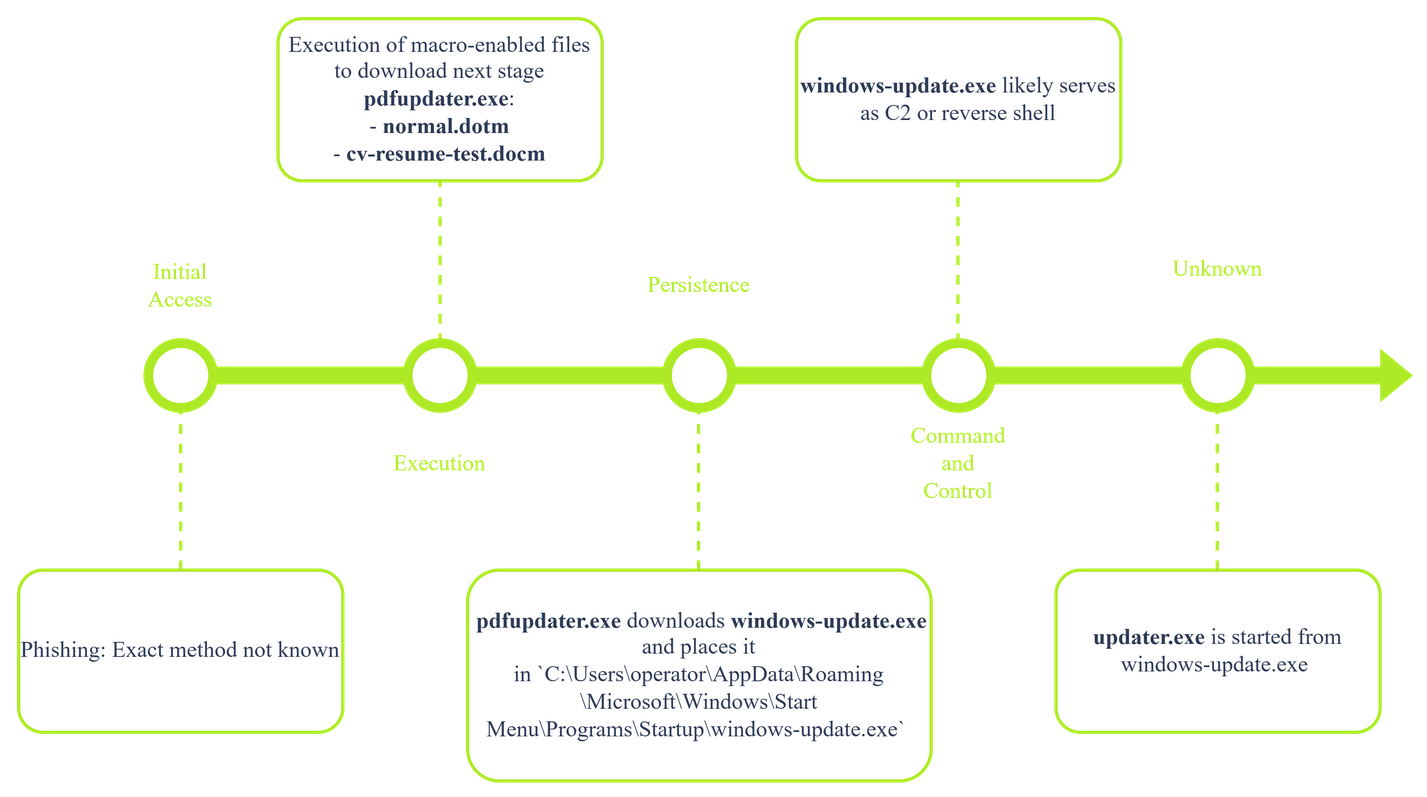
Initial Access
Now, you can only speculate about the attacker's technique to get into the system. Based on the artifacts you have gathered, it is likely that the attacker employed the technique T1566 Phishing to get a malicious macro-enabled Word document onto the system. This needs to be confirmed by analyzing the user's activity on the system.
Execution
The first indicator of compromise starts with the WINWORD.exe process opening a macro-enabled Word file named cv-resume-test.docm or normal.dotm. MITRE categorizes this technique as T1059.005 Command and Scripting Interpreter: Visual Basic
The cv-resume-text.docm or normal.dotm file likely downloads and launches a second-stage malware named pdfupdater.exe. Further analysis of the macro files should confirm this.
Persistence
The malware pdfupdater.exe then likely downloads another stage, windows-update.exe, which starts from the C:\Users\operator\AppData\Roaming\Microsoft\Windows\Start Menu\Programs\Startup\windows-update.exe path. This path typically houses processes or links to processes that start when the OS is loaded. This could be an indicator of persistence. MITRE categorizes this as Boot or Logon Initialization Scripts: Startup Items.
Command and Control
The observation that the windows-update.exe executable is likely persistent could indicate that it serves as a C2 client or reverse shell. Further analysis of this executable should shed some light on its functions.
Attack Phases Not Accounted For
You already have uncovered multiple phases in the kill chain, but there is still one executable that you couldn't place in any of the above phases. For now, you can only speculate about what the updater.exe process does. An educated guess would be that because it originates from the likely C2 process windows-update.exe, it likely will include MITRE tactics like Exfiltration, Impact, Discovery, or Lateral Movement. Analysis of the executable should bring more clarity on its functions.
What's Next
You have uncovered multiple artifacts that need further analysis. You should collect these artifacts, hash them, and then pass them to the threat hunter or malware analyst.
What is the name of the likely compromised user?
operator
What is the ID assigned to the MITRE Tactic Command and Control?
TA0011
Task 9 Conclusion
This room was the first in a series of three that dives into analyzing a memory dump. You went through a real-life scenario and analyzed a memory dump with a focus on extracting processes and their information. You uncovered a potential attack chain and multiple suspicious artifacts.
Analyzing processes is only the beginning. The next steps are analyzing user and network activity.
I am ready to apply my newly obtained skills!
No answer needed